Bike Share Data Analysis
This is a quick summary of a project that I submitted as part of Udacity’s Data Analysis Nanodegree.
Assignment
The assignment was to write some Python code to analyze bike share system ridership data from three different US cities. The code had to take as input three CSVs of ridership data (one each from three different cities), interact with the user to find out if and how they might want to filter the data, and then output some descriptive statistics summarizing the filtered data.
A few of the stats we were required to report were:
- What day of the week (Monday, Tuesday, etc.) had the most ride starts?
- What was the average trip duration?
- What was the most common trip (i.e. combination of start station and end station)?
Once the user had picked which city they wanted to see data from, they then had the option to filter by a particular month or day. So for example, they could look at ridership in Chicago on Tuesdays, New York in January, or D.C. overall.
Before digging into the details here’s a quick demo of my completed (and successful!) solution:
My approach
One of the first decisions I made was to use pandas (a python data analysis library). Although using it was optional, I thought it would make my code cleaner and run more efficiently. So from the beginning I was reading the data from a CSV file into a pandas data frame before manipulating it.
Before attempting to write any permanent code I also made sure to explore the datasets a bit. The last thing I wanted was to write a bunch of code based on an inaccurate or incomplete understanding of the data I was working with. So to that end I did a number of things:
- Figured out how big the datasets were (300,000 rows each as it turned out)
- Checked the columns (it turned out that one of the datasets didn’t have two of the columns that the other datasets had)
- Checked the datatypes of the columns
- looked at the first 30 or so lines of each dataset just to see some example values of all the fields
- Sorted the different columns (ascending and descending) to see if there were any real outliers
Once I felt like I had a good understanding of the data I was working with I commenced writing the code for the assignment.
My initial version of the code wasn’t particularly efficient. I was filtering the selected city’s data frame each time a statistic was calculated. After realizing how much code I was having to copy and paste and how inefficient this was, I decided to refactor my code so that the filtering of the data frame was only done once. This made my code significantly cleaner and improved the efficiency of the program.
I used recursive functions to handle unclear user input. So, for example, if the user entered a city name that we didn’t have data for, the program would print a helpful error message and then call itself in order to ask the user again to select a city.
I also made an effort to display the data in a readable way. For this project we were just interacting with the user via the terminal so there was a limit to how clean and user-friendly I could make it, but within that parameter I tried to display the data as helpfully as I could. So to that end I:
- added a clear header that specified which city these statistics were describing and how, if at all, the data was being filtered.
- added some contextual statistics:
- The overall number of trips for the selected city and time period
- For reporting the most popular trip, in addition to reporting the most common start and end stations I also reported the number of times that trip was taken and the percentage of trips that that unique combination accounted for.
- I also tried to group statistics logically and include blank lines between groups to help the user read them more easily.
I also decided to submit my project using GitHub. Although there was an option to submit my code directly via the Udacity user interface, I decided to submit my project my providing a link to my Github repository. This forced me to really learn how to use Git and GitHub. Although I had been exposed to using both in the past I had never really gotten over the hump in terms of using them in my own workflows. I was able to learn both relatively quickly by following Udacity’s short courses on each.
Feedback
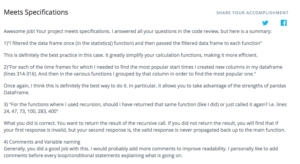
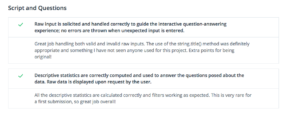
My solution met spec on the first try (which according to my reviewer is very rare!), and I also got some positive feedback for my use of pandas and my approach for handling user input.


Overall this was a great learning experience that has given me a lot of confidence for continuing to build not only my python skills, but also my overall data analysis skills.